Business segments
Last updated: July 7, 2025
We have a complementary business portfolio that is based on three key technologies and packaging types: paperboard conversion packaging, molded fiber packaging and flexible packaging. Our packaging offers consumers convenience, food safety, food availability and food waste reduction.
Huhtamaki announced on February 14, 2025 of separating the Fiber Foodservice Europe-Asia-Oceania business segment into two distinct business segments, Fiber Packaging and Foodservice Packaging. The change took effect on April 1, 2025.
Our business is organised into four segments; Foodservice Packaging, North America, Flexible Packaging and Fiber Packaging. With our global network of manufacturing and sales units, we are well placed to support our customers’ growth wherever they operate.
Read more about the businesses here.
Foodservice Packaging
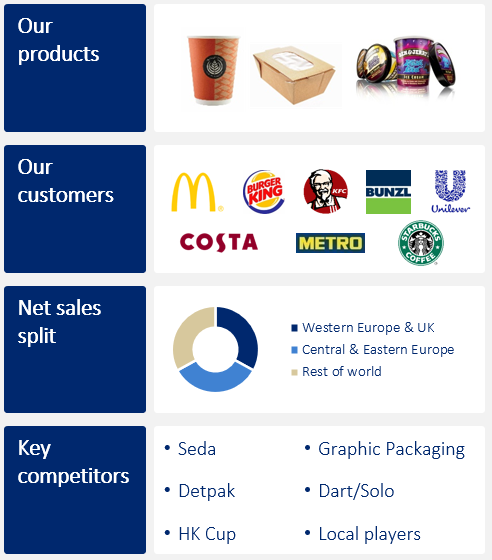
Foodservice paper and plastic disposable tableware, such as cups, is supplied to foodservice operators, fast food restaurants, coffee shops and FMCG companies. The segment has production in Europe, Africa, Middle East, Asia and Oceania.
Foodservice Packaging segment's website
Our competitive advantages
- Unique footprint and leadership position
- Wide product range and scale to serve and innovate globally
- Impeccable quality and service for our customers
- Renewed innovation on sustainability challenges
Focus areas
- Footprint expansion and optimization
- Product portfolio expansion
- Lead in innovation and sustainability
- Drive automation and layout optimization across our factories
Financial ambitions and achievements
| Meur | 2020 | 2021 | 2022 | 2023 | 2024 | Long-term ambition |
| Net sales | 829.1 | 941.8 | 1,110.7 | 1,037.2 | 989.6 | |
| Comparable net sales growth | -10% | 11% | 18% | 2% | -5% | 4-5% |
| Adjusted EBIT | 60.9 | 77.8 | 105.7 | 98.0 | 91.0 | |
| EBIT Margin | 7.3% | 8.3% | 9.5% | 9.4% | 9.2% | 10-12% |
| Adjusted RONA | 7.7% | 9.2% | 10.9% | 10.4% | 10.3% | 13-15% |
| Capex | 78.7 | 85.0 | 118.9 | 64.0 | 66.3 | |
| Operating cash flow | 41.6 | 8.9 | 28.3 | 130.6 | 98.5 | |
| Items affecting comparability | -30.0 | 0.8 | 16.0 | -9.9 | -15.1 |
All figures excluding IAC.
Products, customers, sales split and competitors

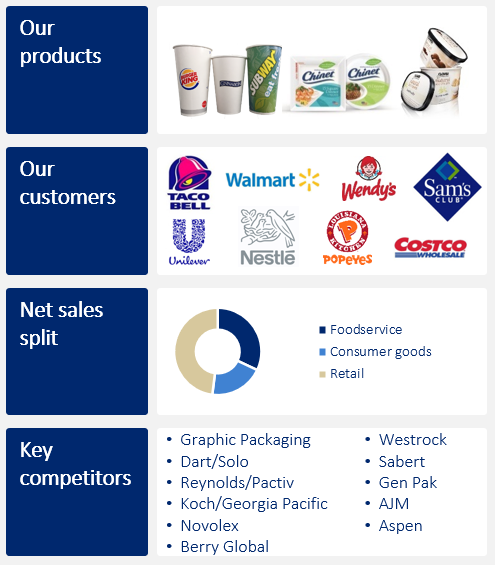
The North America segment serves local markets in North America with retail tableware, foodservice and consumer goods packaging. We are an industry-leading manufacturer of packaging for consumer-packaged goods, as well as tableware, cups, folding cartons, containers, carriers, trays and serviceware for the foodservice industry and retail market. We offer a wide range of packaging for foodservice operators and branded consumer products. We are also the proud makers of Chinet®, one of the most recognized premium retail disposable tableware brand.
The segment has production in the United States and Mexico.
North America segment's website
Our competitive advantages
- Strong footprint across region
- Multi-tenchology offering
- Capability for customer promotions
- Chinet® brand
Focus areas
- Utilize new capacity
- Strengthen position in molded fiber
- Build culture to attract best employees and customers
Financial ambitions and achievements
| Meur | 2020 | 2021 | 2022 | 2023 | 2024 | Long-term ambition |
| Net sales | 1,138.9 | 1,160.3 | 1,468.3 | 1,457.9 | 1,460.1 | |
| Comparable net sales growth | 1% | 6% | 14% | 2% | 0% | 5-6% |
| Adjusted EBIT | 136.6 | 139.1 | 171.6 | 187.9 | 203.4 | |
| EBIT Margin | 12.0% | 12.0% | 11.7% | 12.9% | 13.9% | 11-12% |
| Adjusted RONA | 16.8% | 17.5% | 17.9% | 18.4% | 19.6% | 15-17% |
| Capex | 71.7 | 70.6 | 99.8 | 121.4 | 83.9 | |
| Operating cash flow | 150.1 | 117.0 | 45.6 | 122.2 | 219.5 | |
| Items affecting comparability | -6.5 | -1.9 | -5.6 | 0.0 | -7.6 |
All figures excluding IAC.
Products, customers, sales split and competitors

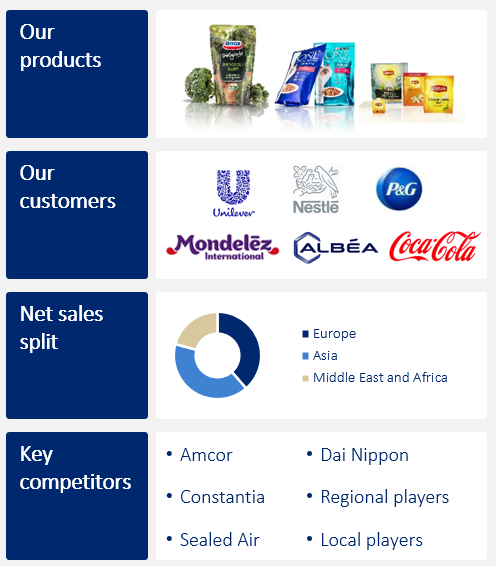
Flexible packaging is used for a wide range of pre-packed consumer products. We offer light and innovative flexible packaging materials, pouches and labels for food and drink, coffee packaging, pet food packaging, barrier packaging, retort pouches and packaging for pharmaceutical products. We serve global and local brands across Europe, Asia, Oceania, and South America.
Flexible Packaging segment's website
Our competitive advantages
- Unmatched footprint in emerging markets
- Good reputation among blue-chip customers
- Global R&D knowhow to speed up innovations & commercialization
- Strong teams & resource pool in India
Focus areas
- Roll out sustainable blueloop solutions fit for the circular economy
- Continue expanding in emerging markets
- Ensure cost competitiveness and continue improvements in operational efficiency
- Build on strength in consumer convenience solutions and agility in on-demand packaging
Financial ambitions and achievements
| Meur | 2020 | 2021 | 2022 | 2023 | 2024 | Long-term ambition |
| Net sales | 1,050.8 | 1,166.4 | 1,558.2 | 1,341.0 | 1,322.5 | |
| Comparable net sales growth | 1% | 7% | 14% | -9% | 1% | 6-7% |
| Adjusted EBIT | 80.7 | 79.8 | 98.1 | 88.0 | 94.2 | |
| EBIT Margin | 7.7% | 6.8% | 6.3% | 6.6% | 7.1% | 9-11% |
| Adjusted RONA | 10.1% | 8.0% | 6.9% | 6.5% | 7.1% | 11-13% |
| Capex | 35.9 | 46.0 | 68.2 | 103.7 | 69.0 | |
| Operating cash flow | 83.8 | 54.9 | 51.5 | 103.9 | 84.1 | |
| Items affecting comparability | -6.2 | -16.1 | -15.9 | 5.8 | -16.6 |
All figures excluding IAC.
Products, customers, sales split and competitors

Fiber Packaging
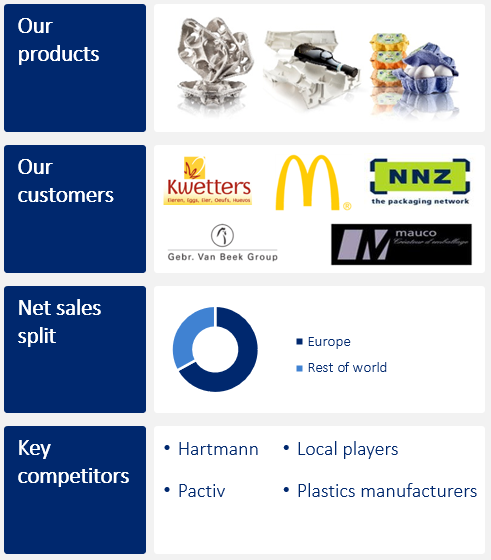
Recycled and other natural fibers are used to make fresh product packaging, such as egg, fruit, food and drink packaging. The segment has production in Europe, Oceania, Africa and South America.
Fiber Packaging segment's website
Our competitive advantages
- Full control throughout the value chain from raw material sourcing to NPD
- Centralized research and development
- Sustainability knowhow
- Local service backed by global knowledge
- Strong teams and continuous knowledge sharing
Focus areas
- Continued investments in new capacity
- Expansion of product portfolio
- Active interest in potential acquisitions
- Innovations and sustainability
- Continuous improvement: operational efficiency, cost management
- Knowledge sharing
Financial ambitions and achievements
| Meur | 2020 | 2021 | 2022 | 2023 | 2024 | Long-term ambition |
| Net sales | 307.8 | 333.6 | 363.0 | 343.1 | 363.2 | |
| Comparable net sales growth | 9% | 2% | 15% | 7% | 6% | 3-4% |
| Adjusted EBIT | 37.4 | 36.4 | 40.0 | 39.6 | 43.5 | |
| EBIT Margin | 12.2% | 10.9% | 11.0% | 11.6% | 12.0% | 11–12% |
| Adjusted RONA | 15.8% | 14.0% | 14.4% | 13.7% | 14.6% | 14-16% |
| Capex | 36.7 | 56.2 | 31.2 | 29.3 | 28.1 | |
| Operating cash flow | 18.9 | -9.3 | 20.9 | 31.8 | 42.6 | |
| Items affecting comparability | -5.2 | -1.1 | 18.1 | -6.2 | -2.2 |
All figures excluding IAC.
Products, customers, sales split and competitors


